Build your own monitoring server with Docker, Prometheus and Grafana
A complete, tested setup with Prometheus, Grafana, Node Exporter, cAdvisor, Alertmanager, Blackbox Exporter and Pushgateway, plus how to monitor your own experiments and batch jobs.
, 10 min read
When you run experiments on a lab cluster, the questions are always the same. Is the GPU node still alive? Which container is eating all the memory? Did last night’s job finish, or did it die at 3 a.m.? Is my training run still making progress?
This guide builds one server that answers all of them. Everything runs in Docker, every configuration file is shown in full, and the whole stack was started and tested before publishing: all eight scrape targets came up healthy and a deliberately failing job fired its alert.
Get the code: every file in this post is in the GitHub repository TakMashhido/docker-monitoring-stack, ready to clone and run.
What you will build
Scroll sideways to see the whole diagram.
| Component | Job | Port |
|---|---|---|
| Prometheus | Pulls metrics, stores them as time series, evaluates alert rules | 9090 |
| Grafana | Dashboards on top of Prometheus | 3000 |
| Alertmanager | Groups alerts and sends them to email, Slack or Telegram | 9093 |
| Node Exporter | CPU, memory, disk, network and temperature of a machine | 9100 |
| cAdvisor | CPU, memory and network of every Docker container | 8080 (internal) |
| Blackbox Exporter | Checks that websites and services answer, and how fast | 9115 (internal) |
| Pushgateway | Holds metrics pushed by short-lived batch jobs | 9091 |
The versions used here were current when I wrote this (Prometheus 3.15, Grafana 13.3, Alertmanager 0.34, Node Exporter 1.12, cAdvisor 0.60, Blackbox Exporter 0.29, Pushgateway 1.11). They are pinned in the compose file so the setup does not change under you.
What you need
- A Linux machine (a VM, a mini PC or a spare lab server) with 2 CPU cores, 2 GB RAM and 20 GB of disk.
- Docker Engine with the Compose plugin. Check with
docker compose version. - Ports 3000, 9090, 9091 and 9093 free on that machine.
Step 1: Create the folder layout
monitoring-stack/
├── docker-compose.yml
├── .env
├── prometheus/
│   ├── prometheus.yml
│   ├── rules/alerts.yml
│   └── targets/nodes.yml
├── alertmanager/alertmanager.yml
├── blackbox/blackbox.yml
├── grafana/
│   ├── provisioning/
│   │   ├── datasources/prometheus.yml
│   │   └── dashboards/dashboards.yml
│   └── dashboards/            # dashboard JSON files go here
└── experiment/                # examples for your own jobs
The quickest way is to clone the repository, which already has this layout:
git clone https://github.com/TakMashhido/docker-monitoring-stack.git
cd docker-monitoring-stack
To build it by hand while following along, create the folders instead:
mkdir -p monitoring-stack/{prometheus/{rules,targets},alertmanager,blackbox,grafana/{provisioning/{datasources,dashboards},dashboards},experiment}
cd monitoring-stack
Step 2: Settings in .env
Compose reads this file automatically. The only value you must change is the Grafana password; Compose refuses to start Grafana until it is set.
# Copy to .env and change the password before the first start.
GRAFANA_ADMIN_USER=admin
GRAFANA_ADMIN_PASSWORD=change-me-now
PROM_RETENTION=30d
PROM_PORT=9090
GRAFANA_PORT=3000
ALERTMANAGER_PORT=9093
PUSHGATEWAY_PORT=9091
cp .env.example .env
nano .env # set GRAFANA_ADMIN_PASSWORDStep 3: The Compose file
This is the heart of the setup. Read the notes below it before you start the stack.
# Monitoring server: Prometheus + Grafana + Alertmanager + exporters.
# Start:  docker compose up -d     Stop: docker compose down
name: monitoring

x-defaults: &defaults
  restart: unless-stopped
  networks: [monitoring]
  logging:
    driver: json-file
    options: { max-size: "10m", max-file: "3" }

services:
  prometheus:
    <<: *defaults
    image: prom/prometheus:v3.15.1
    container_name: prometheus
    command:
      - --config.file=/etc/prometheus/prometheus.yml
      - --storage.tsdb.path=/prometheus
      - --storage.tsdb.retention.time=${PROM_RETENTION:-30d}
      - --web.enable-lifecycle          # allows: curl -X POST localhost:9090/-/reload
    volumes:
      - ./prometheus:/etc/prometheus:ro
      - prometheus-data:/prometheus
    ports:
      - "${PROM_PORT:-9090}:9090"
    extra_hosts:
      - "host.docker.internal:host-gateway"   # lets Prometheus scrape apps running on the host

  alertmanager:
    <<: *defaults
    image: prom/alertmanager:v0.34.2
    container_name: alertmanager
    command:
      - --config.file=/etc/alertmanager/alertmanager.yml
      - --storage.path=/alertmanager
    volumes:
      - ./alertmanager:/etc/alertmanager:ro
      - alertmanager-data:/alertmanager
    ports:
      - "${ALERTMANAGER_PORT:-9093}:9093"

  grafana:
    <<: *defaults
    image: grafana/grafana:13.3.0
    container_name: grafana
    environment:
      GF_SECURITY_ADMIN_USER: ${GRAFANA_ADMIN_USER:-admin}
      GF_SECURITY_ADMIN_PASSWORD: ${GRAFANA_ADMIN_PASSWORD:?set GRAFANA_ADMIN_PASSWORD in .env}
      GF_USERS_ALLOW_SIGN_UP: "false"
      GF_ANALYTICS_REPORTING_ENABLED: "false"
    volumes:
      - ./grafana/provisioning:/etc/grafana/provisioning:ro
      - ./grafana/dashboards:/var/lib/grafana/dashboards:ro
      - grafana-data:/var/lib/grafana
    ports:
      - "${GRAFANA_PORT:-3000}:3000"
    depends_on: [prometheus]

  node-exporter:
    <<: *defaults
    image: prom/node-exporter:v1.12.1
    container_name: node-exporter
    command:
      - --path.rootfs=/host
      - --collector.filesystem.mount-points-exclude=^/(sys|proc|dev|host|etc)($$|/)
    pid: host
    volumes:
      - /:/host:ro,rslave

  cadvisor:
    <<: *defaults
    image: ghcr.io/google/cadvisor:v0.60.6
    container_name: cadvisor
    privileged: true
    devices: ["/dev/kmsg"]
    command:
      - --docker_only=true
      - --housekeeping_interval=15s
    volumes:
      - /:/rootfs:ro
      - /var/run:/var/run:ro
      - /sys:/sys:ro
      - /var/lib/docker/:/var/lib/docker:ro
      - /dev/disk/:/dev/disk:ro

  blackbox:
    <<: *defaults
    image: prom/blackbox-exporter:v0.29.1
    container_name: blackbox
    command: [--config.file=/etc/blackbox/blackbox.yml]
    volumes:
      - ./blackbox:/etc/blackbox:ro

  pushgateway:
    <<: *defaults
    image: prom/pushgateway:v1.11.5
    container_name: pushgateway
    ports:
      - "${PUSHGATEWAY_PORT:-9091}:9091"

networks:
  monitoring:

volumes:
  prometheus-data:
  alertmanager-data:
  grafana-data:
A few lines deserve an explanation:
x-defaultsis a YAML anchor shared by every service: restart automatically, join one private network, and rotate logs so they never fill your disk.- Only Prometheus, Grafana, Alertmanager and Pushgateway publish ports. Node Exporter, cAdvisor and Blackbox are reachable only inside the Docker network, which is all Prometheus needs.
- Node Exporter gets
pid: hostand the host’s root filesystem mounted read-only at/host(withrslaveso new mounts appear). Without these it would report the container, not the machine. The$$in the exclude pattern is how Compose writes a literal$. - cAdvisor needs
privileged,/dev/kmsgand read-only access to/sys,/var/runand/var/lib/dockerto read per-container cgroup statistics. Note that recent releases are published atghcr.io/google/cadvisor, not the oldgcr.ioregistry. extra_hosts: host.docker.internal:host-gatewaylets Prometheus reach programs running directly on the host, such as your experiment scripts.--web.enable-lifecyclelets you reload Prometheus after editing its config without restarting it.
Step 4: Tell Prometheus what to scrape
global:
  scrape_interval: 15s        # how often to pull metrics
  evaluation_interval: 15s    # how often to evaluate alert rules
  external_labels:
    monitor: lab-monitoring

rule_files:
  - /etc/prometheus/rules/*.yml

alerting:
  alertmanagers:
    - static_configs:
        - targets: ["alertmanager:9093"]

scrape_configs:
  # Prometheus watching itself
  - job_name: prometheus
    static_configs:
      - targets: ["localhost:9090"]

  # This server's CPU, memory, disk, network
  - job_name: node
    static_configs:
      - targets: ["node-exporter:9100"]
        labels: { instance_name: monitoring-server }
    # Other machines: list them in targets/nodes.yml (reloaded automatically)
    file_sd_configs:
      - files: ["/etc/prometheus/targets/nodes.yml"]
        refresh_interval: 1m

  # Per-container CPU, memory, network, restarts
  - job_name: cadvisor
    static_configs:
      - targets: ["cadvisor:8080"]

  # Is this website up, and how fast does it answer?
  - job_name: blackbox-http
    metrics_path: /probe
    params:
      module: [http_2xx]
    static_configs:
      - targets:
          - https://prometheus.io
          - http://grafana:3000/api/health
    relabel_configs:
      - source_labels: [__address__]
        target_label: __param_target
      - source_labels: [__param_target]
        target_label: instance
      - target_label: __address__
        replacement: blackbox:9115

  # Metrics pushed by short batch jobs
  - job_name: pushgateway
    honor_labels: true          # keep the job/instance labels the batch job pushed
    static_configs:
      - targets: ["pushgateway:9091"]

  # Long-running experiments that expose /metrics (see experiment/train_with_metrics.py)
  - job_name: experiments
    scrape_interval: 5s
    static_configs:
      - targets: ["host.docker.internal:8000"]
        labels: { experiment: demo-training }

  - job_name: alertmanager
    static_configs:
      - targets: ["alertmanager:9093"]
How the pieces work:
scrape_interval: 15sis a good default. Theexperimentsjob overrides it with5sbecause training metrics change quickly.file_sd_configsreads extra machines fromtargets/nodes.yml. Prometheus re-reads that file every minute, so adding a node needs no restart.- The
blackbox-httpjob looks odd but is the standard pattern: Prometheus calls the Blackbox Exporter’s/probeendpoint, and therelabel_configspass each website as thetargetparameter while keeping its URL as theinstancelabel. honor_labels: trueon the Pushgateway job keeps thejoblabel your batch job pushed, instead of overwriting it withpushgateway.
Start the node list empty; Step 10 shows how to fill it.
# Add one entry per machine running node-exporter on port 9100.
# Prometheus re-reads this file every minute; no restart needed.
# - targets: ["192.168.1.21:9100"]
#   labels: { instance_name: jetson-01, role: edge }
# - targets: ["192.168.1.22:9100"]
#   labels: { instance_name: rpi5-01, role: edge }
[]
Step 5: Alert rules
Alert rules are PromQL expressions that should normally return nothing. When one returns a result for longer than its for: duration, the alert fires.
groups:
  - name: hosts
    rules:
      - alert: TargetDown
        expr: up == 0
        for: 2m
        labels: { severity: critical }
        annotations:
          summary: "{{ $labels.job }} target {{ $labels.instance }} is down"
          description: "Prometheus could not scrape it for 2 minutes."

      - alert: HighCpuUsage
        expr: 100 - (avg by (instance) (rate(node_cpu_seconds_total{mode="idle"}[5m])) * 100) > 90
        for: 10m
        labels: { severity: warning }
        annotations:
          summary: "CPU above 90% on {{ $labels.instance }}"
          description: "Current value: {{ $value | printf \"%.1f\" }}%"

      - alert: LowMemory
        expr: node_memory_MemAvailable_bytes / node_memory_MemTotal_bytes < 0.10
        for: 5m
        labels: { severity: warning }
        annotations:
          summary: "Less than 10% memory left on {{ $labels.instance }}"

      - alert: DiskWillFillIn24h
        expr: predict_linear(node_filesystem_avail_bytes{fstype!~"tmpfs|overlay"}[6h], 24 * 3600) < 0
        for: 30m
        labels: { severity: warning }
        annotations:
          summary: "{{ $labels.mountpoint }} on {{ $labels.instance }} will be full within 24 h"

  - name: services
    rules:
      - alert: WebsiteDown
        expr: probe_success{job="blackbox-http"} == 0
        for: 2m
        labels: { severity: critical }
        annotations:
          summary: "{{ $labels.instance }} is not responding"

      - alert: ContainerRestarting
        expr: changes(container_start_time_seconds{name!=""}[15m]) > 2
        labels: { severity: warning }
        annotations:
          summary: "Container {{ $labels.name }} restarted more than twice in 15 minutes"

  - name: experiments
    rules:
      - alert: ExperimentStalled
        expr: time() - experiment_last_step_timestamp_seconds > 600
        for: 1m
        labels: { severity: warning }
        annotations:
          summary: "Experiment {{ $labels.experiment }} has not reported progress for 10 minutes"

      - alert: BatchJobFailed
        expr: batch_job_success == 0
        labels: { severity: critical }
        annotations:
          summary: "Batch job {{ $labels.job }} reported failure"
for: 2mstops a single failed scrape from waking you up.predict_linearfits a line to the last 6 hours of free disk space and fires if that line hits zero within 24 hours. You get warned before the disk is full, not after.ExperimentStalleduses a timestamp your experiment updates on every step (Step 11). If it stops moving for 10 minutes, the run has hung or crashed.
Step 6: Where alerts go
Alertmanager receives firing alerts from Prometheus, groups related ones into one message, and sends them to a receiver.
route:
  receiver: default
  group_by: [alertname, instance]
  group_wait: 30s
  group_interval: 5m
  repeat_interval: 4h
  routes:
    - matchers: [severity="critical"]
      receiver: default
      repeat_interval: 1h

receivers:
  - name: default
    # Uncomment ONE of these and fill in your details.
    # email_configs:
    #   - to: you@example.com
    #     from: alerts@example.com
    #     smarthost: smtp.gmail.com:587
    #     auth_username: you@example.com
    #     auth_password: your-app-password
    # telegram_configs:
    #   - bot_token: "123456:ABC..."
    #     chat_id: 123456789
    # slack_configs:
    #   - api_url: https://hooks.slack.com/services/XXX/YYY/ZZZ
    #     channel: "#alerts"

inhibit_rules:
  - source_matchers: [severity="critical"]
    target_matchers: [severity="warning"]
    equal: [instance]
Uncomment one receiver and fill it in:
- Gmail: turn on two-step verification, create an app password in your Google account’s security settings, and use it as
auth_password. Never use your real password. - Telegram: create a bot with
@BotFatherto get the token, send the bot a message, then openhttps://api.telegram.org/bot<TOKEN>/getUpdatesto find yourchat_id. - Slack: create an incoming webhook for a channel and paste its URL.
The inhibit_rules block silences warnings for a machine while a critical alert for the same machine is firing, so a dead server sends one message instead of five.
Step 7: Uptime probes
modules:
  http_2xx:
    prober: http
    timeout: 10s
    http:
      preferred_ip_protocol: ip4
      valid_status_codes: []   # empty = any 2xx
      follow_redirects: true
  tcp_connect:
    prober: tcp
    timeout: 5s
  icmp:
    prober: icmp
    timeout: 5s
http_2xx is used by the blackbox-http job. Add your own websites to the targets list in prometheus.yml. tcp_connect checks that a port accepts connections (an SSH server or a database), and icmp is a ping.
Step 8: Connect Grafana automatically
Provisioning files mean you never click through Grafana’s setup screens: the data source and dashboards exist from the first start.
apiVersion: 1
datasources:
  - name: Prometheus
    uid: prometheus
    type: prometheus
    access: proxy
    url: http://prometheus:9090
    isDefault: true
    jsonData:
timeInterval: 15sapiVersion: 1
providers:
- name: lab
folder: Lab
type: file
allowUiUpdates: true
options:
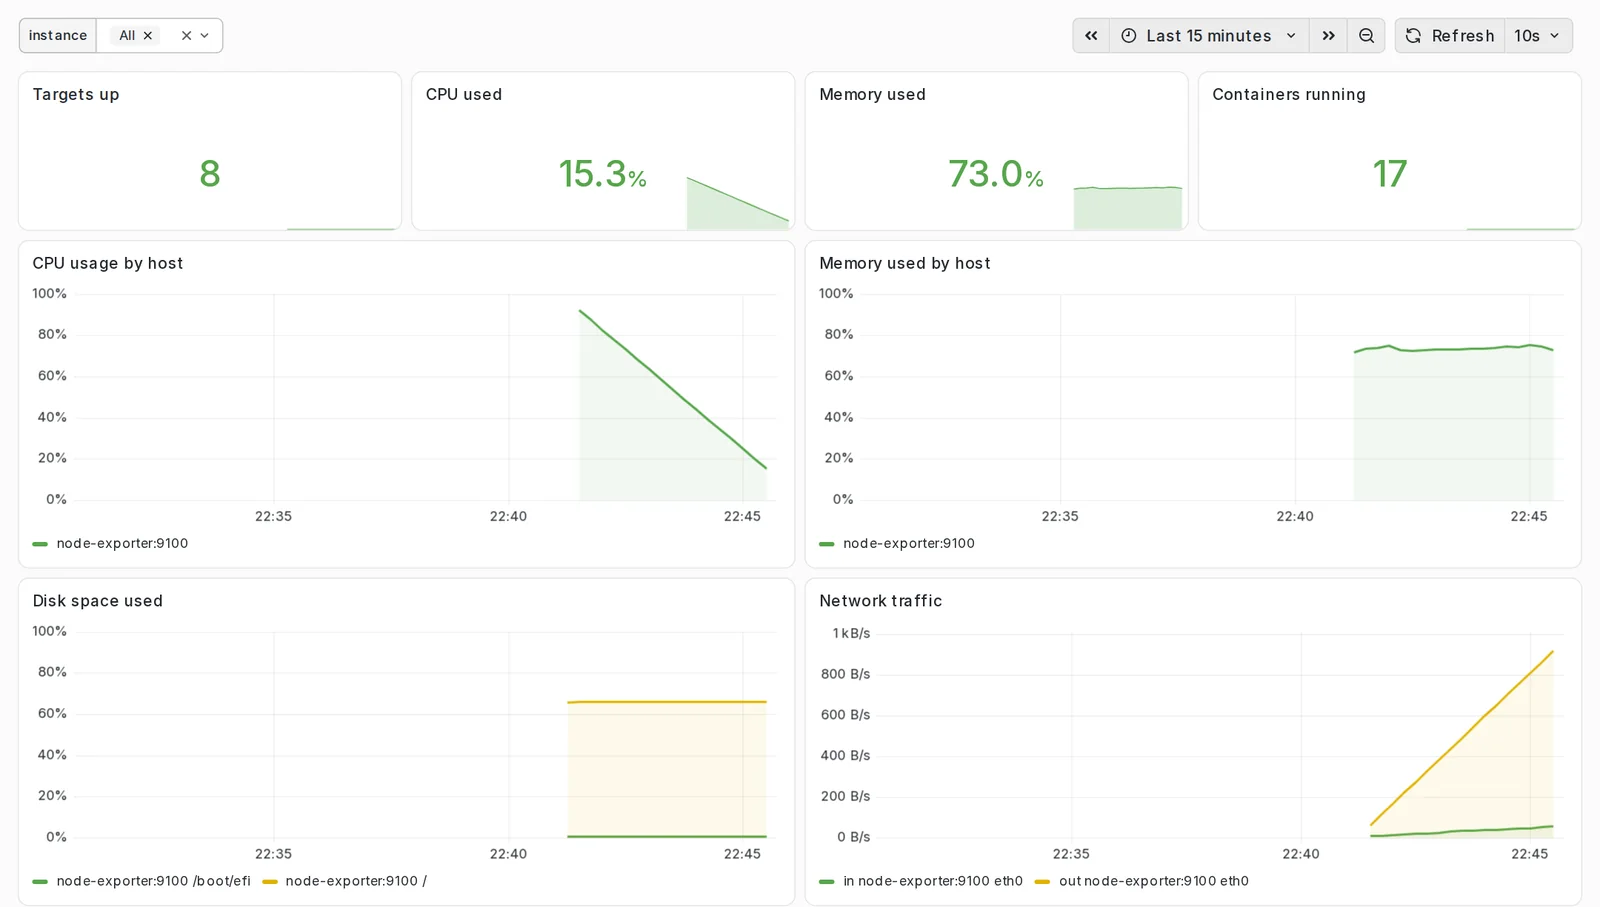
path: /var/lib/grafana/dashboardsAny dashboard JSON file you drop into grafana/dashboards/ appears in a Lab folder. The download includes two dashboards I wrote for this setup, Host and container overview and Experiments. For a very detailed host view, also import the community dashboard Node Exporter Full (ID 1860): in Grafana go to Dashboards → New → Import, enter 1860 and pick the Prometheus data source.
Step 9: Start and check it
Validate the configs first. Both tools ship inside the official images, so there is nothing to install:
docker run --rm -v "$PWD/prometheus:/etc/prometheus:ro" --entrypoint promtool \
  prom/prometheus:v3.15.1 check config /etc/prometheus/prometheus.yml

docker run --rm -v "$PWD/alertmanager:/etc/alertmanager:ro" --entrypoint amtool \
  prom/alertmanager:v0.34.2 check-config /etc/alertmanager/alertmanager.yml
Then start everything and check that all containers are running:
docker compose up -d
docker compose ps
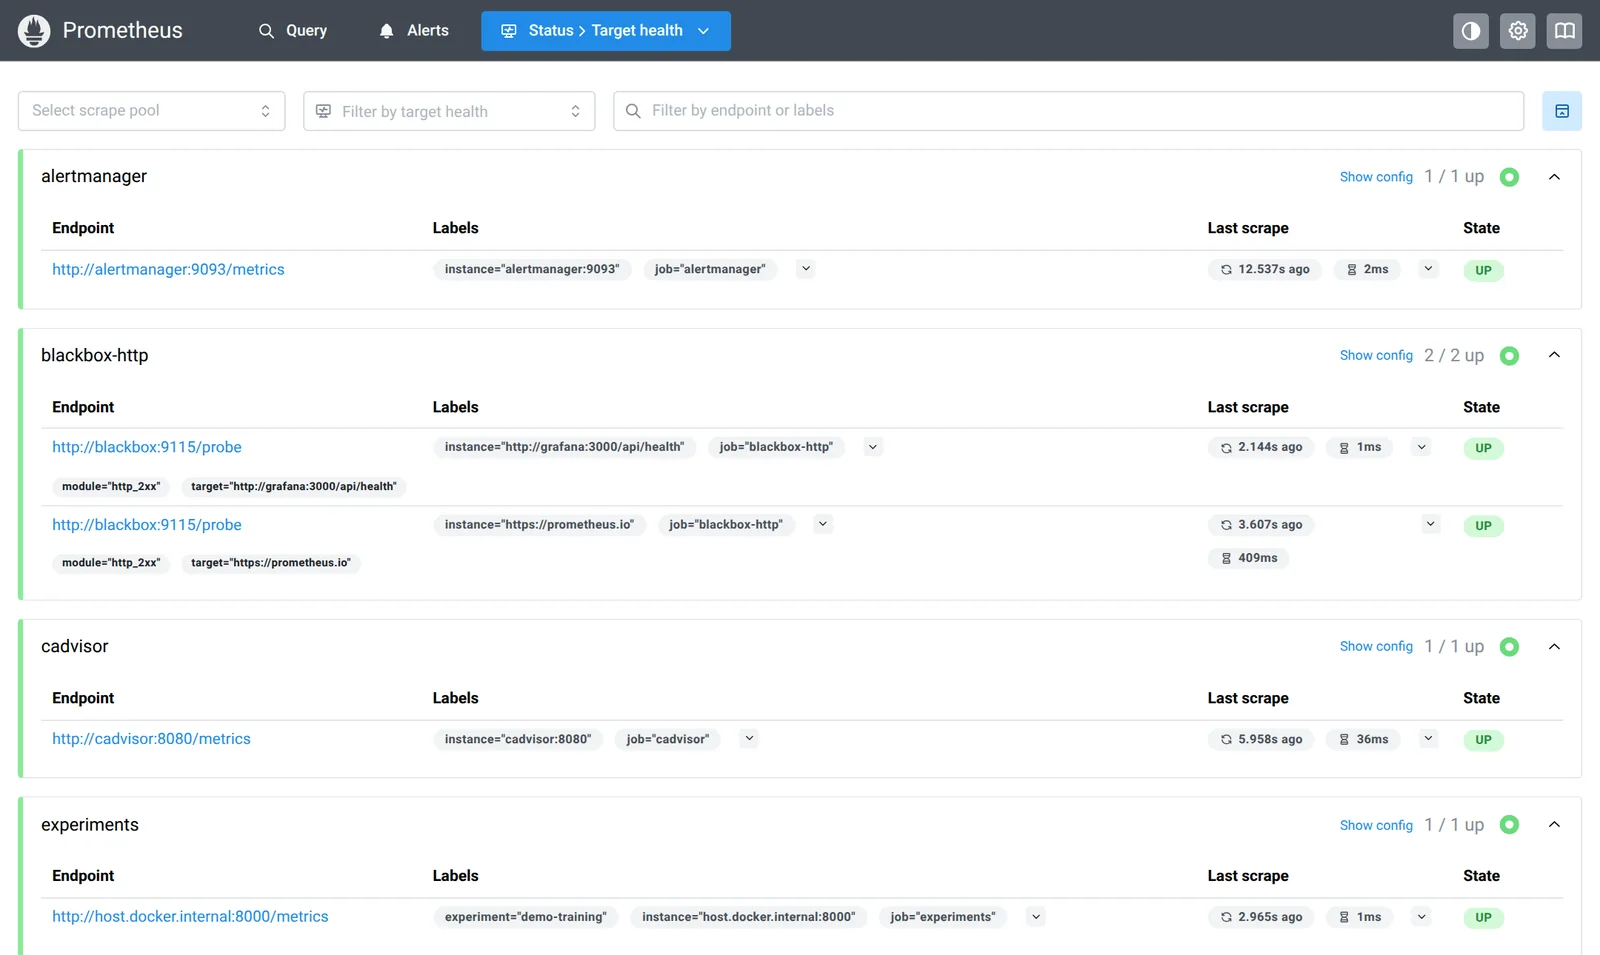
Open http://<server-ip>:9090/targets. Every target should be green and UP. (The experiments target stays down until Step 11 starts an experiment.)
Now open Grafana at http://<server-ip>:3000, sign in with the user and password from .env, and open Dashboards → Lab → Host and container overview:
After editing any Prometheus file later, reload it without downtime:
curl -X POST http://localhost:9090/-/reloadStep 10: Monitor more machines
Run Node Exporter on every machine you want to watch. On each one:
docker run -d --name node-exporter --restart unless-stopped \
  --net host --pid host -v /:/host:ro,rslave \
  prom/node-exporter:v1.12.1 --path.rootfs=/host
Then list it in prometheus/targets/nodes.yml on the monitoring server. Labels such as role let you filter dashboards and alerts later:
- targets: ["192.168.1.21:9100"]
  labels: { instance_name: jetson-01, role: edge }
- targets: ["192.168.1.22:9100"]
  labels: { instance_name: rpi5-01, role: edge }
Within a minute the new machines appear in the instance drop-down of the host dashboard. Node Exporter publishes ARM64 images, so this works on Raspberry Pi and Jetson boards too. If a node has a firewall, allow port 9100 only from the monitoring server’s IP.
To watch the containers on another Docker host, run cAdvisor there with the same volumes as in the compose file and add a target for its port 8080.
Step 11: Monitor your own experiments
This is where the setup pays off for research. There are two patterns, and choosing the right one matters.
| Your program… | Use | Why |
|---|---|---|
| runs for minutes to days (training, simulations, servers) | Expose /metrics, Prometheus pulls | You see progress live and can alert on stalls |
| finishes in seconds or minutes (backups, sweeps, cron jobs) | Push to the Pushgateway at the end | The program may exit before Prometheus ever scrapes it |
Long-running experiments: expose metrics
The official Python client starts a tiny web server inside your program. Update gauges and counters as your loop runs:
"""Expose live metrics from a long-running experiment so Prometheus can scrape them.

    pip install prometheus-client
    python train_with_metrics.py          # metrics at http://localhost:8000/metrics

Replace the fake training loop with your own code; keep the metric updates.
"""
import math
import random
import time

from prometheus_client import Counter, Gauge, Histogram, start_http_server

LOSS = Gauge("experiment_loss", "Current training loss")
ACCURACY = Gauge("experiment_accuracy", "Current validation accuracy (0-1)")
EPOCH = Gauge("experiment_epoch", "Current epoch")
LR = Gauge("experiment_learning_rate", "Current learning rate")
STEPS = Counter("experiment_steps", "Training steps completed")  # exported as experiment_steps_total
STEP_TIME = Histogram(
    "experiment_step_duration_seconds",
    "Time per training step",
    buckets=(0.05, 0.1, 0.2, 0.3, 0.5, 1, 2),
)
LAST_STEP = Gauge("experiment_last_step_timestamp_seconds", "Unix time of the last completed step")


def train(epochs: int = 50, steps_per_epoch: int = 100) -> None:
    lr = 0.01
    for epoch in range(epochs):
        EPOCH.set(epoch)
        LR.set(lr)
        for step in range(steps_per_epoch):
            with STEP_TIME.time():                      # measures how long this block takes
                time.sleep(random.uniform(0.08, 0.25))  # <- your real training step goes here
            progress = epoch + step / steps_per_epoch
            LOSS.set(2.3 * math.exp(-progress / 8) + random.uniform(0, 0.05))
            STEPS.inc()
            LAST_STEP.set_to_current_time()
        ACCURACY.set(min(0.99, 1 - math.exp(-(epoch + 1) / 6) + random.uniform(-0.01, 0.01)))
        lr *= 0.95


if __name__ == "__main__":
    start_http_server(8000)   # serves /metrics in a background thread
    train()
Which metric type to use:
- Gauge for values that go up and down: loss, accuracy, learning rate, GPU temperature.
- Counter for things that only increase: steps, samples, errors. Always query them with
rate(). - Histogram for durations: step time, request latency. It lets you ask for percentiles.
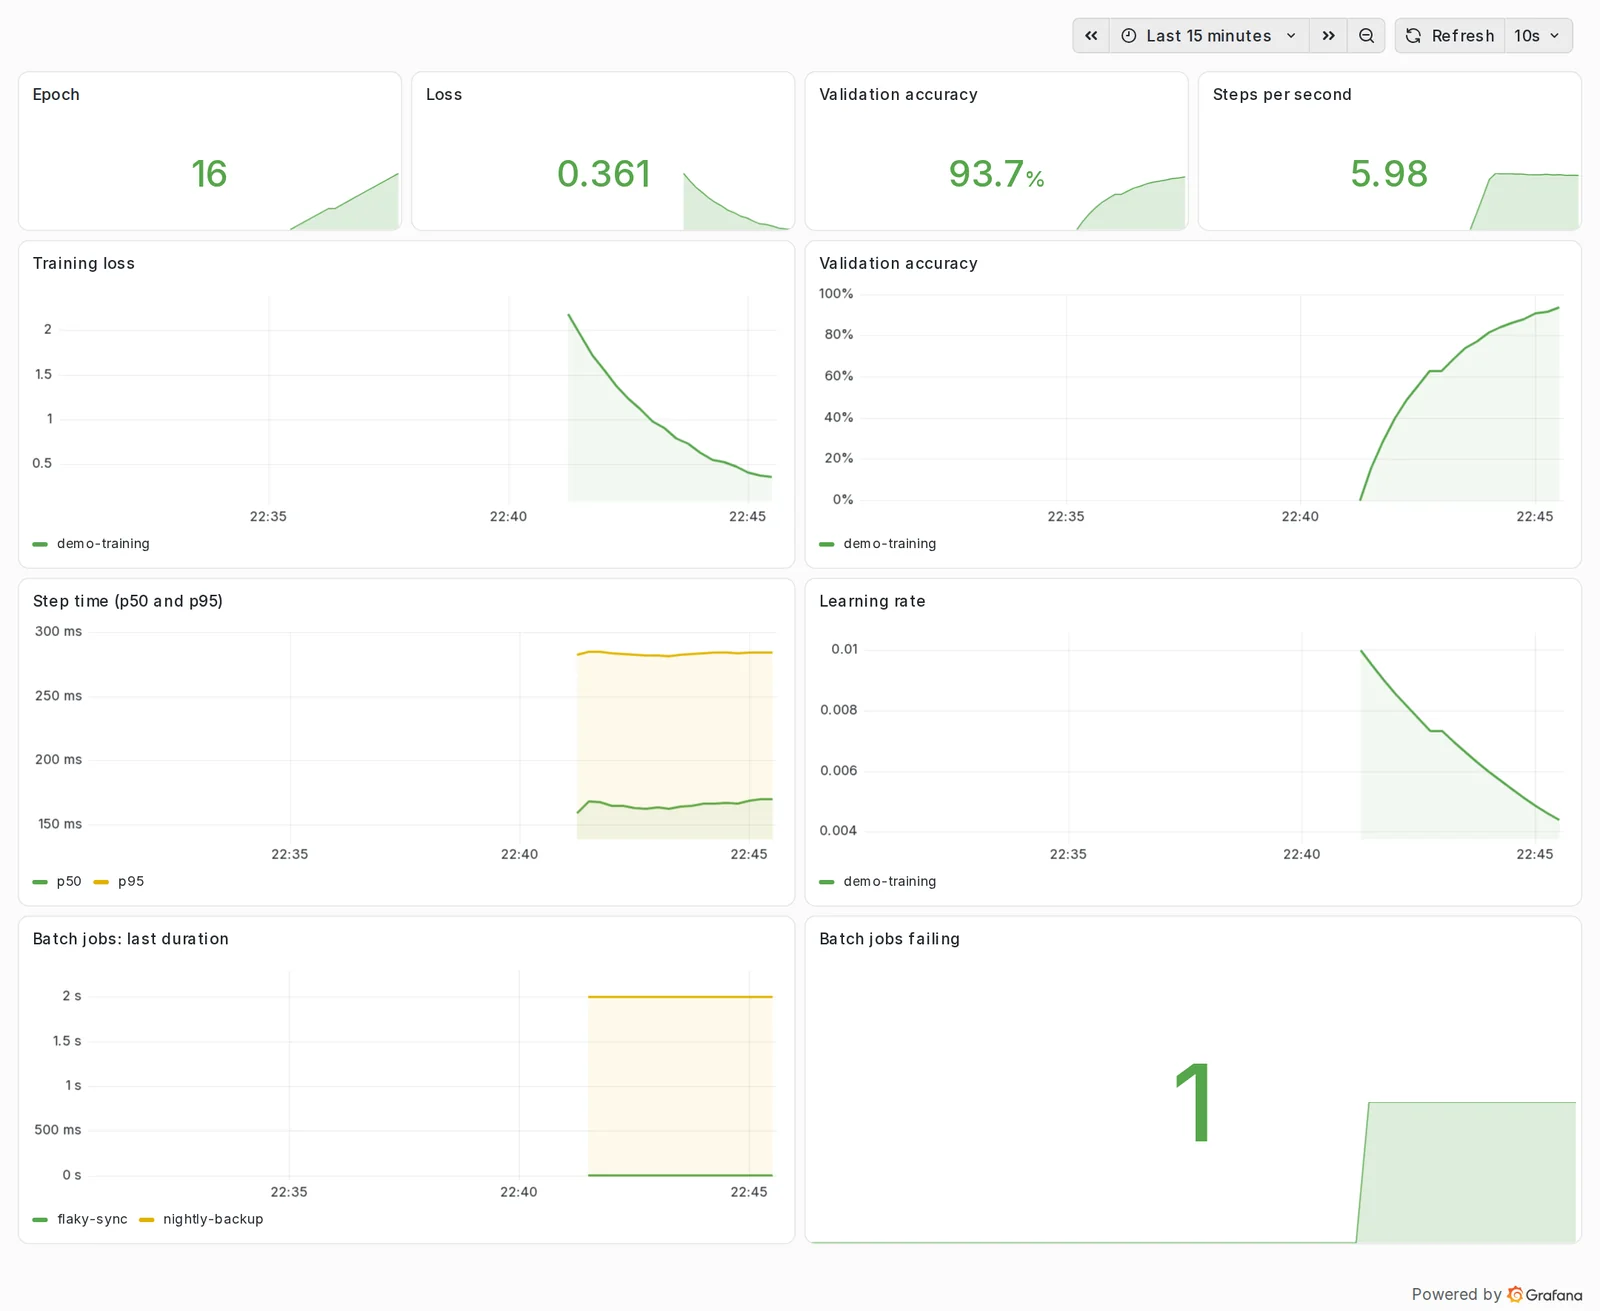
Run it on the monitoring server (or change the experiments target to the machine’s IP), and the Experiments dashboard comes alive:
Running several experiments? Give each one its own port and target, with an experiment label naming it:
- job_name: experiments
  scrape_interval: 5s
  static_configs:
    - targets: ["host.docker.internal:8000"]
      labels: { experiment: xor-puf-k4 }
    - targets: ["host.docker.internal:8001"]
      labels: { experiment: xor-puf-k6 }
Short jobs: push when you finish
This wrapper runs any command, then pushes its duration and success to the Pushgateway. Because the job name is part of the URL, each job keeps its own last result.
#!/usr/bin/env bash
# Run any command and push its outcome to the Pushgateway.
# Usage: ./run_batch_job.sh <job-name> <command...>
# Example: ./run_batch_job.sh nightly-backup tar czf /backup/data.tgz /data
set -uo pipefail
PUSHGATEWAY="${PUSHGATEWAY:-http://localhost:9091}"
JOB="$1"; shift

start=$(date +%s.%N)
"$@"; status=$?
end=$(date +%s.%N)
duration=$(echo "$end - $start" | bc)
success=$([ "$status" -eq 0 ] && echo 1 || echo 0)

cat <<METRICS | curl -s --data-binary @- "$PUSHGATEWAY/metrics/job/$JOB/instance/$(hostname)"
# TYPE batch_job_duration_seconds gauge
batch_job_duration_seconds $duration
# TYPE batch_job_success gauge
batch_job_success $success
# TYPE batch_job_last_run_timestamp_seconds gauge
batch_job_last_run_timestamp_seconds $(date +%s)
METRICS

echo "job=$JOB status=$status duration=${duration}s pushed to $PUSHGATEWAY"
exit "$status"
./run_batch_job.sh nightly-backup tar czf /backup/data.tgz /data
./run_batch_job.sh dataset-sync rsync -a lab:/datasets/ /data/In crontab, a nightly job becomes 0 2 * * * /opt/monitoring-stack/experiment/run_batch_job.sh nightly-backup /opt/scripts/backup.sh. If it fails, the BatchJobFailed alert fires. If a job stops running at all, alert on its age:
time() - batch_job_last_run_timestamp_seconds{job="nightly-backup"} > 26 * 3600From Python, push final results of a parameter sweep with labels, so you can compare runs in Grafana:
"""Push final results of a short experiment (one that ends before Prometheus can scrape it).

    pip install prometheus-client
    python push_results.py
"""
import time

from prometheus_client import CollectorRegistry, Gauge, push_to_gateway

registry = CollectorRegistry()
accuracy = Gauge("experiment_final_accuracy", "Accuracy at the end of the run", ["model"], registry=registry)
duration = Gauge("experiment_duration_seconds", "Wall-clock time of the run", ["model"], registry=registry)
success = Gauge("batch_job_success", "1 if the run finished without error", registry=registry)

start = time.time()
result = 0.947                       # <- run your experiment here and collect its result
accuracy.labels(model="xor-arbiter-lr").set(result)
duration.labels(model="xor-arbiter-lr").set(time.time() - start)
success.set(1)

push_to_gateway("localhost:9091", job="puf-attack-sweep", registry=registry)
print("pushed")
Step 12: Useful PromQL to start with
| Question | PromQL |
|---|---|
| CPU used per machine (%) | 100 - avg by (instance) (rate(node_cpu_seconds_total{mode="idle"}[5m])) * 100 |
| Memory used (%) | (1 - node_memory_MemAvailable_bytes / node_memory_MemTotal_bytes) * 100 |
Free disk on / (GB) | node_filesystem_avail_bytes{mountpoint="/"} / 1e9 |
| Top 5 containers by memory | topk(5, container_memory_working_set_bytes{name!=""}) |
| Training steps per second | rate(experiment_steps_total[1m]) |
| 95th percentile step time | histogram_quantile(0.95, sum by (le) (rate(experiment_step_duration_seconds_bucket[5m]))) |
| Is a website up? | probe_success{job="blackbox-http"} |
| Which targets are down? | up == 0 |
Try each one in Prometheus under Query before you put it on a dashboard.
Step 13: Keep it safe and healthy
- Do not expose Prometheus, Alertmanager or Pushgateway to the internet. They have no login. Either change their port lines to
"127.0.0.1:9090:9090"and reach them through an SSH tunnel, or allow them only from your lab network in the firewall. - Put Grafana behind HTTPS with a reverse proxy such as Caddy or Nginx if people reach it from outside, and keep sign-up disabled.
- Retention:
PROM_RETENTION=30dkeeps a month of data. Each scraped series costs roughly 1–2 bytes per sample; a few machines for a year fits comfortably in a few GB. - Back up the Grafana volume, which holds users and any dashboards edited in the UI:
docker run --rm -v monitoring_grafana-data:/data -v "$PWD":/backup alpine \
tar czf /backup/grafana-$(date +%F).tgz -C /data .- Update deliberately: change one image tag at a time in
docker-compose.yml, then rundocker compose pull && docker compose up -d.
Troubleshooting
| Symptom | Likely cause and fix |
|---|---|
| Grafana will not start: set GRAFANA_ADMIN_PASSWORD | .env is missing or the password is empty. Copy .env.example to .env. |
experiments target is DOWN with connection refused | Your script is not running, or it listens only on 127.0.0.1 inside another container. start_http_server(8000) listens on all interfaces by default. |
| A remote node is DOWN with context deadline exceeded | Firewall on the node. Allow port 9100 from the monitoring server. |
| cAdvisor shows no containers | It needs privileged: true and the /var/lib/docker and /sys mounts. On cgroup v2 hosts, keep the image up to date. |
| Disk panel shows odd mount points | Adjust the mount-points-exclude pattern on Node Exporter, or filter by mountpoint in the query. |
| Pushed metrics never disappear | That is by design: the Pushgateway keeps the last push. Delete a job’s group with curl -X DELETE http://localhost:9091/metrics/job/<name>. |
| Alerts show in Prometheus but no message arrives | Check http://<server-ip>:9093 to see if Alertmanager received them, then check the receiver settings and the Alertmanager logs with docker compose logs alertmanager. |
Where to go next
- GPUs: NVIDIA’s
dcgm-exporterexposes GPU utilisation, memory and temperature for data-centre and desktop GPUs; run it on GPU nodes and add a target. - Logs: Grafana Loki stores logs next to your metrics, so you can jump from a spike on a chart to the log lines from that minute.
- Long-term storage: if you need years of history across many machines, look at Thanos or Grafana Mimir.
The complete, tested stack is on GitHub at TakMashhido/docker-monitoring-stack. Clone it, copy .env.example to .env, set the password, and run docker compose up -d. Issues and pull requests are welcome.